How It Works
The data and science behind the forecasts
This page explains the methodology and science behind Maui Wind Swell's forecasts — how wind data is processed from weather models, how swell is tracked from deep-ocean buoys to Maui's coastline, and how tide predictions are generated.
Wind Forecast
Wind data comes from the WRF model (Weather Research and Forecasting), a mesoscale numerical weather prediction system run at 2km resolution by the University of Hawaii's Department of Atmospheric Sciences under Dr. Yi-Leng Chen's research group. The data is served via the PacIOOS ERDDAP server.
Regional Wind Summaries
Wind conditions are summarized for five distinct regions around Maui, each sampling wind from specific nearshore areas.
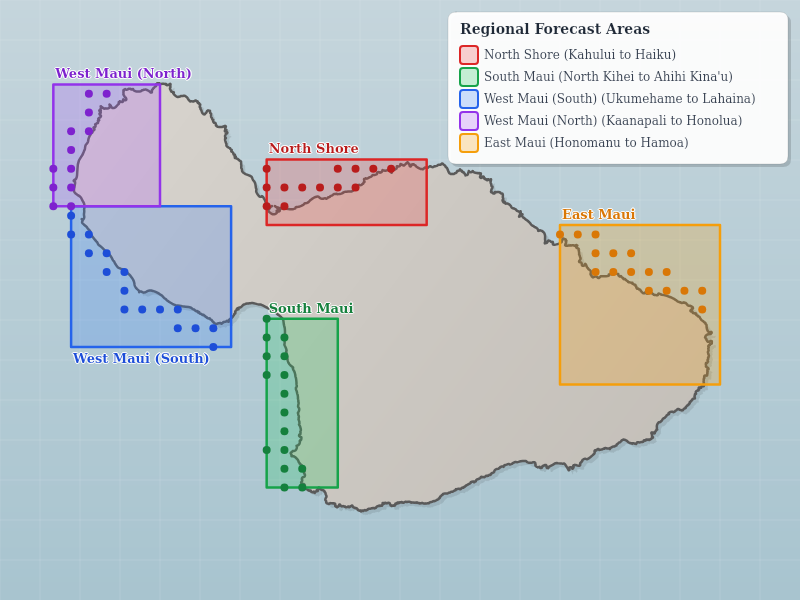
- Water points only – Grid points over land are excluded
- Nearshore focus – Only points within 3km of the coastline are included
- Averaged readings – Each region samples 13-15 grid points for representative statistics
- AI summaries – Text descriptions are generated using AI based on the forecast data
The "UH WRF" toggle on the main page shows original forecast maps from the UH WRF website.
Tide Predictions
Tide predictions come from the NOAA CO-OPS API. Each region uses the nearest tide station:
- North Shore – Kahului Harbor
- South Maui – Kihei, Maalaea Bay
- West Maui – Lahaina
- East Maui – Hana
Swell Forecast
Swell forecasts are built from NDBC buoy spectral data. The last 48 hours of hourly observations from deep ocean and offshore buoys are decomposed into individual swell components (height, period, direction), then each observation is propagated forward in time to estimate arrival at each Maui region. The Buoys page shows these observations on an interactive map with great circle routes and estimated travel times.
Ground swell refers to long-period waves (10s+) from distant storms – clean, organized wave energy. Wind swell refers to short-period waves (<10s) from local or regional winds – choppier, less organized conditions.
Upstream Buoys (Propagation Model)
Six deep ocean and offshore buoys provide upstream swell detection:
- Deep ocean – 51101 (NW Hawaii), 51000 (N Hawaii), 51002 (SW Hawaii), 51004 (SE Hawaii)
- Offshore – 51208 (Hanalei), 51201 (Waimea)
For each swell component, travel time is calculated based on period and distance, shadow-line filtering removes swells blocked by island geometry, and arrival height accounts for distance decay and angular offset. Multiple observations of the same swell train are grouped and produce hour-by-hour arrival predictions, capturing how swells build, peak, and fade through the day.
Nearshore Buoy Blending
Today's forecast uses direct nearshore buoy observations instead of the propagation model. Each buoy's swell components are filtered through the region's exposure window so only relevant directions are used:
- North Shore, West Maui (North), East Maui (20°–110° only) – Pauwela Buoy (51205)
- South Maui, West Maui (South) – Kaumalapau Buoy (51213)
Tomorrow's forecast always uses the propagation model, since nearshore buoys only reflect current conditions.
3-Tier Blended Cascade
The swell forecast blends three data sources in a priority cascade. For each forecast hour, the system selects data from the highest-available tier:
- Tier 1: Nearshore Observations – Direct spectral readings from CDIP/NDBC buoys close to Maui. Used for past hours of the current day (ground truth).
- Tier 2: Buoy Propagation + Correction Model – Deep-water buoy observations propagated to Maui via group velocity, with empirical height corrections. Covers roughly 0–18 hours from now.
- Tier 3: WW3 Model Forecast – PacIOOS WaveWatch III gridded wave model at deep-water buoy grid points, propagated through the same pipeline. Extends the forecast from ~18 hours to 5 days.
Each forecast hour is tagged with its source (nearshore, propagation, or ww3). Higher-tier data always takes precedence when available.
Empirical Correction Model
To improve propagation accuracy, the system applies an empirical correction model trained on 14 years (2012–2025) of paired deep-water and nearshore observations. Each entry is keyed by direction bin, period bin, and month, with a multiplicative height correction factor.
| Region | Direction | Period | Month | Factor | Samples |
|---|---|---|---|---|---|
| North Shore | 315–360° | 14–18s | Jan | 1.27 | 14,682 |
| North Shore | 315–360° | 10–14s | Dec | 1.20 | 12,239 |
| North Shore | 0–45° | 10–14s | Feb | 1.22 | 2,441 |
| North Shore | 0–45° | 7–10s | Jul | 1.88 | 2,163 |
| North Shore | 45–90° | 7–10s | Jan | 3.00 | 6,211 |
A factor > 1 means the propagation model underpredicts for that direction/period/month combination. The system looks up the best match for each component: exact direction + period + month (requiring ≥ 30 samples), then falls back to broader averages, defaulting to 1.0 if no match is found.
WW3 Extended Forecast
Beyond the ~18-hour buoy propagation horizon, the forecast uses PacIOOS WaveWatch III model data:
- Grid points – WW3 data is sampled at the same deep-water buoy locations used by the propagation model
- Bias correction – A −0.14m height adjustment corrects WW3's systematic overprediction, measured from ~17,000 paired observations
- Same pipeline – Synthetic observations are propagated through the same group-velocity and swell-window pipeline as real buoy data
- 3-hourly timesteps – Extends the forecast out to 5 days with decreasing reliability
At the crossover between nearshore observations and the propagation model, a live adjustment factor anchors the forecast to observed conditions. This ratio corrects propagation estimates so they align with what the nearshore buoy is actually measuring. The adjustment applies at full strength for today, decays to 50% for tomorrow, then fades out for extended forecast days.
Each region has defined swell exposure windows based on coastline orientation and island blocking. Swells from outside these windows are filtered out. See the Swell Exposure Windows section below, or explore them interactively on the Buoys page. Learn more from GP's Maui Surf Report →
Swell Exposure Windows
Maui sits in a chain of volcanic islands. Molokai, Lanai, and Kahoolawe block swell from certain directions, creating shadow zones where wave energy cannot reach a given coastline. The remaining open angles form that region's swell exposure window — the compass bearings from which waves can arrive unobstructed.
Exposure Windows by Region
- North Shore (Kahului to Haiku) — 280°–360° and 0°–90°. Open to the full north Pacific plus northeast trade-wind swell. Molokai partially blocks swell west of 280°.
- South Maui (Kihei to Ahihi Kina'u) — 150°–250°. Open to south and southwest swells. Kahoolawe blocks energy from the west; Maui's own mass blocks north swells.
- West Maui South (Ukumehame to Lahaina) — 185°–275°. Faces the Auau Channel between Maui and Lanai. Receives southwest to west swells through the channel gap.
- West Maui North (Kaanapali to Honolua) — 280°–350°. Open to northwest swells. Molokai blocks swell north of 350°; Lanai blocks swell south of 280°.
- East Maui (Honomanu to Hamoa) — 20°–135°. Faces east, directly exposed to trade wind swell and northeast groundswell. Hawaii Island blocks swells from the SSE; Maui’s own mass blocks west and most north swells.
The specific degree ranges used for each region are adapted from GP's Maui Surf Report, a local knowledge resource for Maui surf forecasting. The general concept of island shadowing is well-documented by the University of Hawaii SOEST.
In reality, swell does not travel in perfectly straight lines. When waves encounter shallow bathymetry — underwater ridges, reef shelves, or the sloping seafloor around an island — they slow down and bend in a process called refraction. This can cause wave energy to wrap around headlands and islands, reaching coastlines that would appear blocked on a simple ray diagram. The effect is most pronounced for powerful, long-period swells that interact with the seafloor further offshore: for example, large west and northwest swells are known to refract around Kahoolawe and wrap into South Maui, producing occasional surf at spots like Kihei that a straight-line shadow model would not predict.
Interactive Swell Direction Explorer
Click or drag on the map below to set a swell direction. Regions that receive swell from that direction light up; blocked regions are dimmed.
How Swell Travels
Ocean swell is generated by distant storms and travels as wave groups across the open ocean. Individual wave crests move at the phase velocity, but the energy of the group moves at half that speed — the group velocity. This is the speed that matters for swell arrival time.
Group Velocity Formula
In deep water, group velocity depends only on wave period:
- cg – group velocity (m/s)
- g – gravitational acceleration (9.81 m/s²)
- T – wave period (seconds)
Converting to nautical miles per hour (knots), this simplifies to a practical rule:
A 15-second period swell travels at roughly 22.5 knots (~26 mph). A 20-second swell moves at ~30 knots.
If you watch a wave group closely, individual crests appear at the back, grow as they move through the group, then shrink and vanish at the front. The energy packet (the group) moves at half the speed of any single crest. This is a fundamental result of wave dispersion in deep water.
Travel Time Estimation
Given a buoy's distance from Maui and the swell period, we calculate how long it takes for wave energy to arrive:
Worked Example
Buoy 51101 (NW Hawaii) is ~280 nm from Maui's North Shore. For a 16-second swell:
- Speed = 16 × 1.5 = 24 knots
- Travel time = 280 / 24 = ~11.7 hours
So a 16s swell observed at buoy 51101 at 6am would arrive at the North Shore around 5:40pm the same day.
Buoy Distance Table
Distances (nautical miles) from each upstream buoy to each Maui region, measured along great circle routes:
| Buoy | North Shore | South Maui | W. Maui (S) | W. Maui (N) | East Maui |
|---|---|---|---|---|---|
| 51101 (NW Hawaii) | 280 | 310 | 290 | 270 | 365 |
| 51000 (N Hawaii) | 170 | 200 | 205 | 195 | 215 |
| 51002 (SW Hawaii) | 390 | 360 | 345 | 365 | 265 |
| 51004 (SE Hawaii) | 200 | 185 | 225 | 235 | 295 |
| 51208 (Hanalei) | 200 | 235 | 215 | 195 | 195 |
| 51201 (Waimea) | 185 | 215 | 195 | 180 | 115 |
Swell doesn't follow a single path — it refracts around islands and diffracts into channels. These distances represent the great circle route and serve as a useful first approximation. Actual arrival times may vary by 1–2 hours depending on local bathymetry and refraction effects.
Wave Height
Buoys measure wave height using spectral analysis. Rather than tracking individual waves, the buoy records its vertical acceleration and computes the frequency spectrum of wave energy. The significant wave height (Hs) is derived from this spectrum:
What Does This Mean?
- m0 is the zeroth spectral moment — the total area under the wave energy spectrum. It represents the total wave energy present.
- Hs (significant wave height) closely approximates the average height of the highest one-third of waves, which is what experienced observers report as "wave height".
- The factor of 4 comes from the statistical properties of a Gaussian sea surface. This is the internationally accepted standard defined by the NDBC.
Height Decay Factors
As swell travels from a distant buoy to Maui, its height decreases due to several factors:
- Distance decay – Wave energy spreads over a wider area as it radiates outward. Height decays roughly proportional to 1/√distance.
- Angular offset – Swell arriving at an oblique angle to a coastline delivers less energy per unit length of beach. We apply a cosine correction for the angle between the swell direction and the optimal angle for each region.
- Directional spread – Real ocean swell isn't a perfectly narrow beam. A wider spread means the energy is distributed over more directions, reducing the effective height at any single coastline.
In Hawaii, wave heights are traditionally reported as the "Hawaiian scale" which roughly corresponds to the back of the wave (approximately half the face height). Buoy measurements report Hs, which is closer to the wave face. A buoy reading of 6 ft Hs might be called "3 foot Hawaiian." This site uses buoy-reported Hs values throughout.
Wind Forecast Accuracy
How accurate are these forecasts? The Wind Forecast Accuracy page compares today's WRF wind predictions against live observations from NOAA CO-OPS and NWS stations near Maui.
Sources & Further Reading
- NDBC: How Spectral Wave Data Is Derived NOAA — Buoy measurement methodology and spectral analysis
- NDBC: Wave Calculations NOAA — Zeroth spectral moment and Hs = 4√m0 derivation
- Why Surf Heights Vary Around the Hawaiian Islands University of Hawaii SOEST — Island shadowing and coastal exposure
- Coastal Dynamics: Wave Groups Bosboom & Stive — Group velocity derivation and dispersion
- Dispersion (water waves) Wikipedia — Formal dispersion relation and deep-water approximation
- StormSurf: Wave Basics Surf forecasting reference — speed ≈ T × 1.5 knots practical rule
- GP's Maui Surf Report Local knowledge — Shadow line degree estimates for each Maui region
- Surfline: The Importance of Swell Period Accessible explanation of why period matters more than height alone